Tourism Data Analysis
A Java batch pipeline over hotel listings and reviews: collect with Jsoup, clean into structured records, persist to HBase, aggregate with Hadoop MapReduce, and prepare the results for ECharts and a word cloud. It was a 2024 data-engineering coursework study on Hadoop 2.7 and HBase 1.3, and it is kept as a record of that stack in the repository, under MIT. No scraped data is committed.
Two analyses are computed—average hotel price per city, and word frequency over review text—and the word-frequency job exists in two forms, a distributed MapReduce version and a single-machine version.
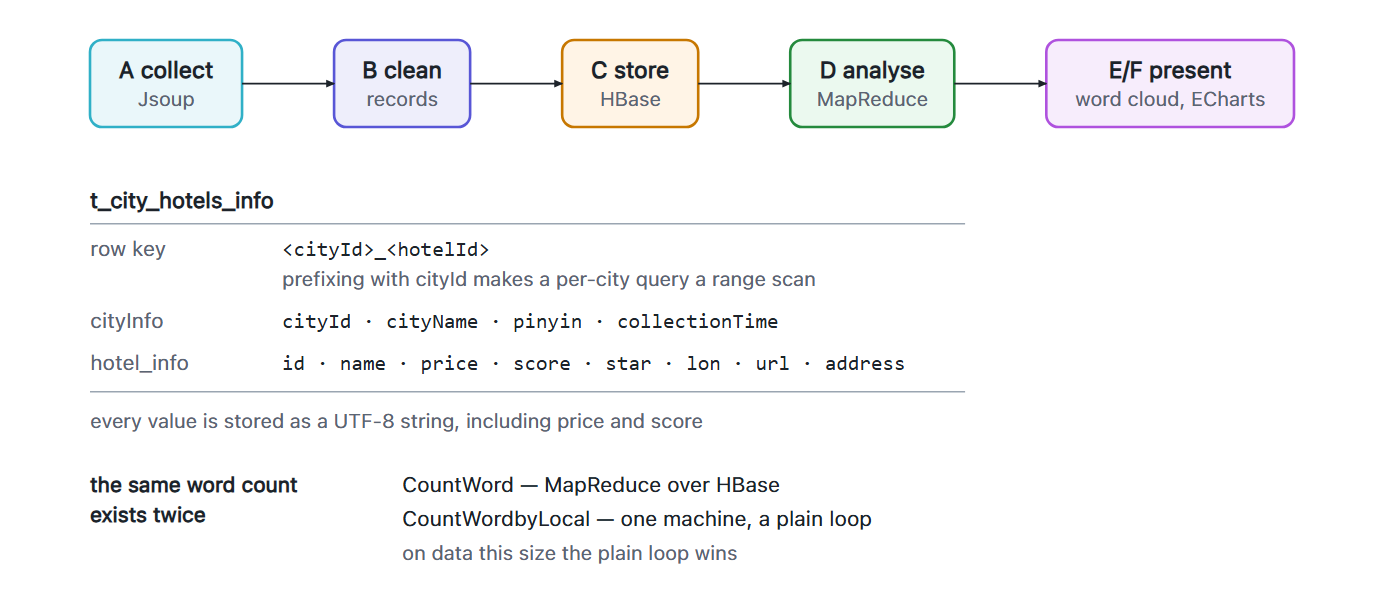
The pipeline
Five stages, each in its own package named A_ through F_ so the directory
listing reads in execution order. Each stage hands off through HBase or through a file, not through
method calls, so any stage can be re-run on its own. Collection fetches a commercial travel platform's
pages through Jsoup; cleaning turns them into flat Hotel, HotelCity and
HotelComment records; storage writes them to two HBase tables; analysis runs the
MapReduce jobs; presentation renders a word cloud and prepares chart series.
What a page becomes
The collector never hands raw HTML to anything downstream. Each fetched page is parsed once and
reduced to three flat records—HotelCity for the place, Hotel for the
listing, HotelComment for a single review—so that every later stage works against
fields with names and types rather than against a document. That boundary is what lets the pipeline
survive a change in the source markup: a different page layout moves the parser and nothing else.
It is also what makes the stages independent. Because each one leaves its output in HBase or in a
file rather than returning it from a method, collection can run overnight, cleaning can be re-run
against what was collected, and the analysis can be repeated any number of times without touching
the network again. The A_ to F_ package prefixes are the same idea applied
to the source tree: the directory listing is the execution order.
The schema
t_city_hotels_info holds one row per hotel under the row key
<cityId>_<hotelId>, with city fields in one column family and hotel fields in
another. HBase sorts rows lexicographically and has no secondary index, so the row key is the only
access path a query gets for free. Putting the city id first is what turns “every hotel in city
X” into a contiguous range scan instead of a full-table filter, and every question this
pipeline asks is a per-city question—so the key is designed around the query, not around the
record.
Splitting the columns into two families follows the same reasoning. City fields are written once and read on every scan; hotel fields are the wide part and change independently. Keeping them apart lets a scan touch only the family it needs. Values are stored as UTF-8 strings throughout, price and score included, which keeps every cell readable straight from the shell and puts the type conversion in one place: the mapper, where the aggregation happens anyway.
The same word count, twice
The distributed version reads each review's text from HBase, strips emoji, segments the Chinese text
with a dictionary-based segmenter, and emits (word, 1) for a reducer to sum. Chinese has
no whitespace word boundaries, so segmentation is not optional—it is the whole difficulty of the
job—and stripping emoji first matters because review text is full of them and they otherwise
become spurious tokens. The local version does exactly the same thing as a plain loop on one machine,
without Hadoop.
Writing it twice was the point. The MapReduce version is the one that would carry a corpus the cluster was built for: the map step is per-review and shares nothing, so the work splits across as many nodes as there are region servers, and the reducer only ever sees one word's counts at a time. The loop is the same computation with the frameworks taken away, and on a few tens of thousands of reviews it finishes before Hadoop has finished starting. Having both means the cost of the distribution is visible rather than assumed—which is the thing worth knowing about a stack like this.
The average-price job is the other half of the analysis and the simpler shape: the mapper scans the hotel table, keys on the city id, and emits the price; the reducer averages. It is the job the row key was designed for, and it reads the table in exactly the order the key already sorts it.
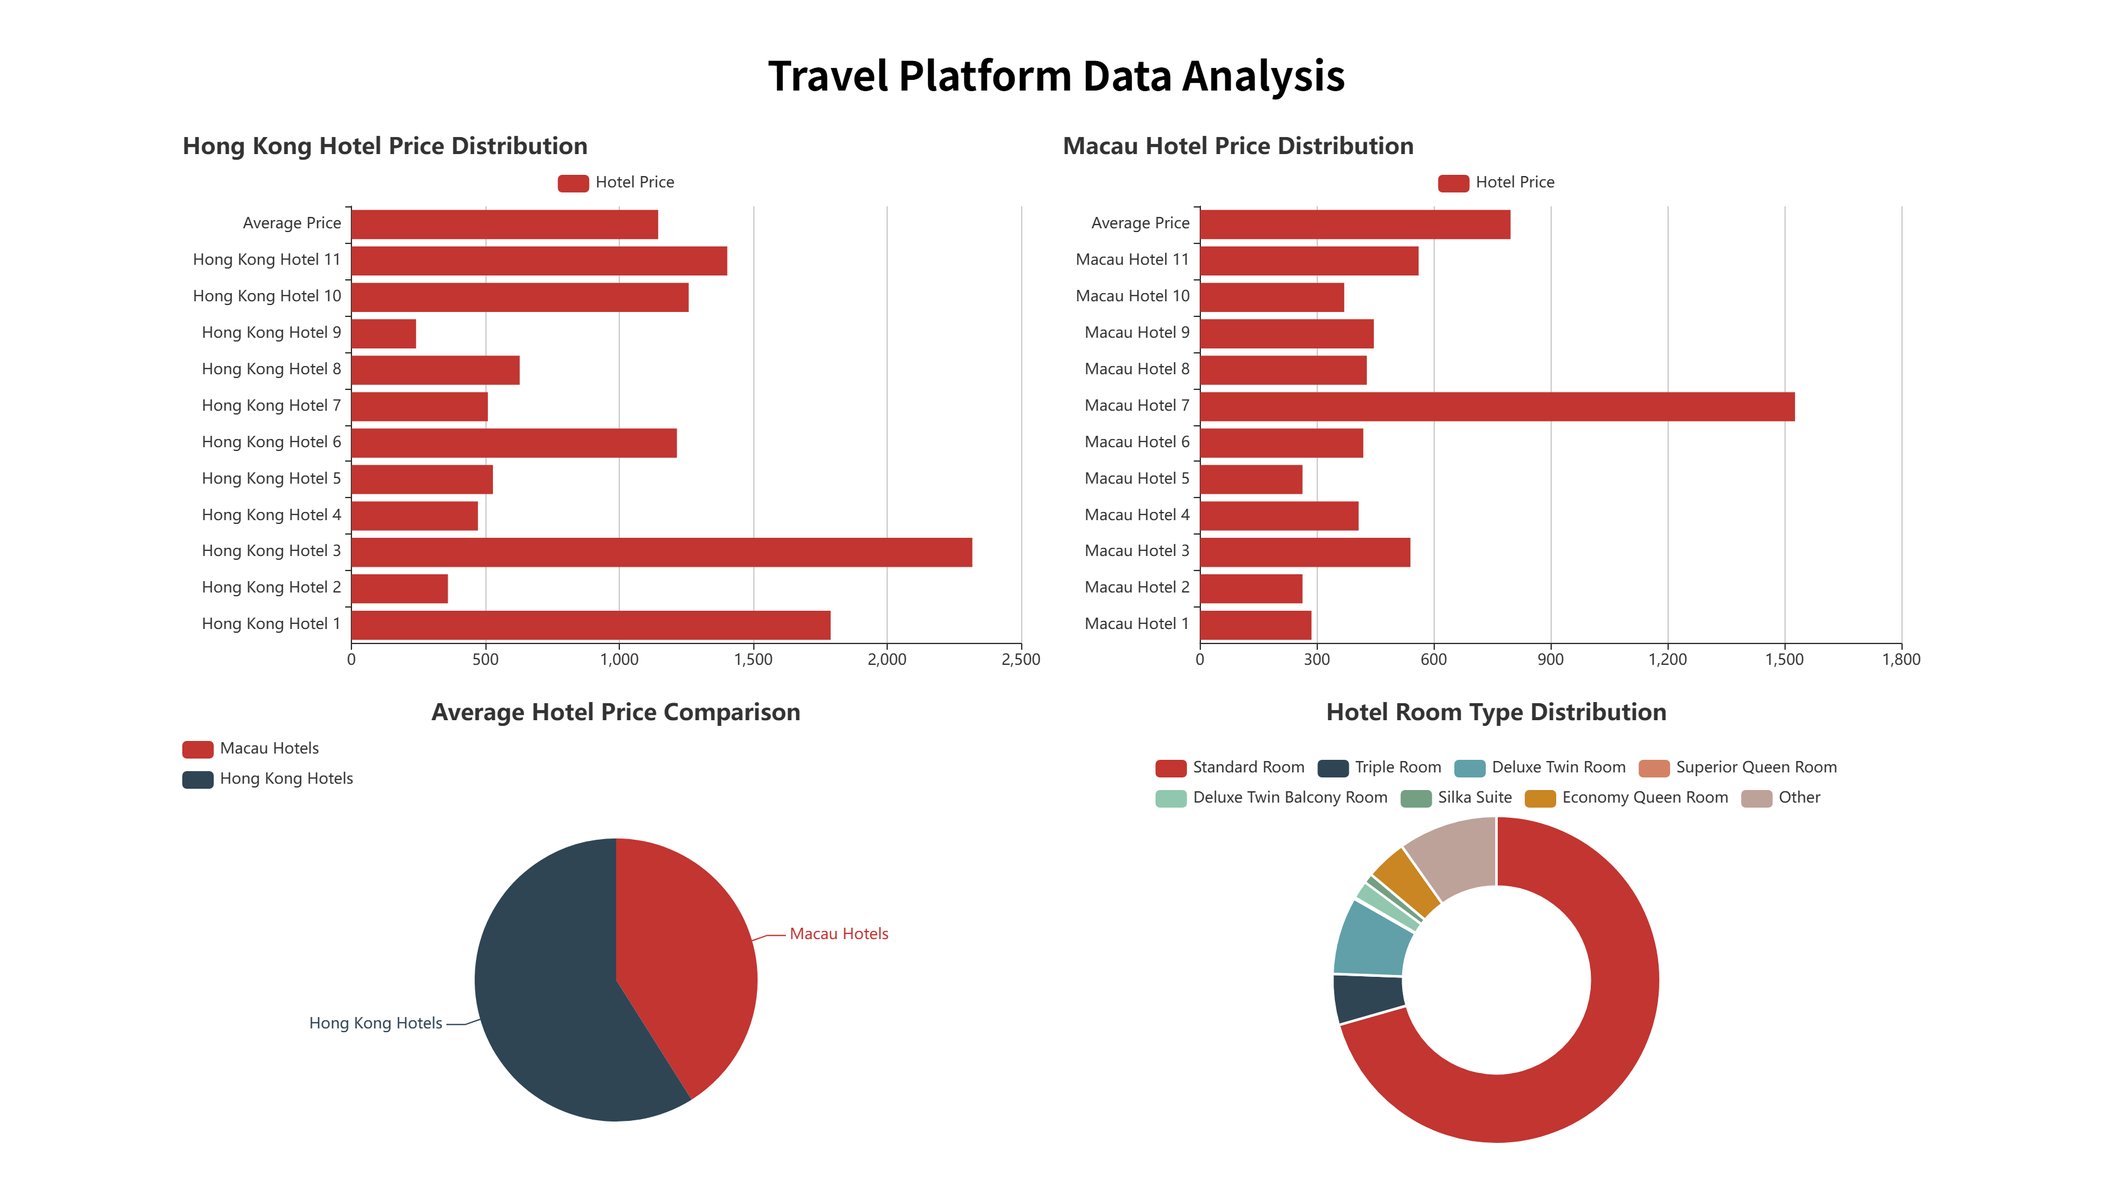
The presentation stage takes both results back out of HBase—the word-frequency table into a word cloud masked by a silhouette, the price table into an ECharts series—so the page at the end of the pipeline is produced by the pipeline rather than assembled by hand.
Results
The chart stage reads the aggregated tables back out of HBase and renders them as an ECharts page. This is that page, produced by the pipeline from the collected listings.